INTERACTIVE EXAMPLES
The Matrix has you
Every technology presented on this page represents a concrete lever for generating measurable
value: lower operating costs, optimised production processes, higher
energy efficiency and improved ROI. These are not abstract demos, but solutions
ready to be integrated into your business systems.
Cocce develops custom enterprise software that turns these technologies into a competitive
advantage: optimisation algorithms for logistics and production, artificial
intelligence for automation and decision support, physical simulations for engineering and
quality control, through to
Advergaming and Interactive
Experiences
where algorithms, simulations and AI are applied to business goals such as lead generation,
product launch and gamified corporate training. Every solution is designed to digitalise
business processes
and generate tangible savings, measured in person-hours recovered, reduced consumption, waste
minimised and optimal resource saturation.
The result for your organisation: leaner processes, faster decisions,
lower operating costs and a scalable software platform that grows with your business.
All technologies can be used via a browser and integrated on web,
mobile, desktop, interactive kiosks, embedded systems and machine-edge platforms, with a
multi-target approach that enables industrial interconnection, data acquisition, real-time
monitoring and advanced automation.
Contact us to turn
these technologies into a project tailored to your company.
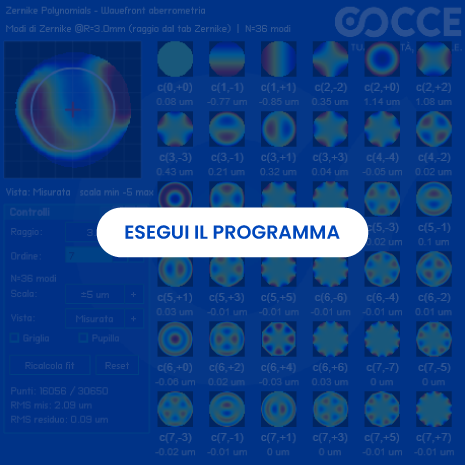
Click on the image to launch the interactive Zernike polynomial viewer: each polynomial describes a specific wavefront aberration on a circular pupil.
The demo shows how the sum of the polynomials builds the complete 3D wavefront map of the eye — the so-called “optical fingerprint”: no two eyes generate an identical map.
Use the demo to understand the difference between a flat wavefront (an ideally perfect eye) and an aberrated wavefront: it is the objective basis on which wavefront-guided LASIK, custom lenses and cataract IOLs are designed.
This technology did not remain a demo: we brought it into clinical production with a cloud platform for over 20,000 patients and distributed sites, which centralises diagnostic examinations from different machines and applies machine learning to indicate the most appropriate procedure.
Read the Gruppo Refrattivo Italiano case — See the case in Projects
Value for your company
- The wavefront examination (aberrometry) measures in a few seconds and in an objective way how light passes through the cornea, crystalline lens and vitreous humour, without depending on the patient's subjective responses as in a traditional phoropter. The result is a 3D map of aberrations that can be used for diagnosis, surgical planning and lens design.
- For ophthalmic clinics, refractive surgery centres, ophthalmic device manufacturers and medical software companies this means: more precise diagnoses, personalised treatments (wavefront-guided LASIK, custom IOLs), fewer side effects such as halos and double images, especially in night vision.
- Cocce turns this mathematics into clinical and industrial software: browser visualisation, multi-machine data acquisition, cloud centralisation, dashboards and decision-support models — as already done for the Gruppo Refrattivo Italiano (project sheet).
What we did: from the wavefront to the optical fingerprint
- Three-stage measurement, like a real aberrometer: (1) measurement of the pupil diameter to build the flat reference wavefront, (2) projection of light into the eye and capture of the front reflected by the retina, (3) point-by-point comparison and generation of the aberration map. The demo makes this process visible and manipulable.
- Zernike polynomials (Fritz Zernike, 1934): the standard mathematical language for decomposing the total refractive error. Each polynomial describes one aberration: low order (myopia, hyperopia, astigmatism) and high order (coma, trefoil, spherical aberration, up to more than 60 classified shapes). The sum of the terms returns the Zernike prescription plus topographic map.
- GRI clinical platform in production: data acquisition from different types of diagnostic machines into a single centralised system, shared multi-site platform on Microsoft Azure cloud, machine learning to suggest the type of procedure, follow-up, real-time statistics and immediate calculation of refractive indices. Stack: PostgreSQL, C#, Delphi, REST API, Docker, Next/TypeScript.
What we solve
- Subjective diagnoses and lens fitting: the phoropter requires time and patient cooperation. Aberrometry provides an objective measurement in seconds, useful as a basis for high-definition glasses and contact lenses, as well as for surgery.
- Ignored high-order aberrations: night halos, reflections and double images after conventional LASIK often stem from uncorrected coma, spherical aberration and trefoil. The wavefront map makes them measurable and correctable with latest-generation lasers, custom lenses and adjustable IOLs.
- Fragmented diagnostic data: every machine with its own format, every site with its own archive. As in the project for the Gruppo Refrattivo Italiano, we centralise acquisition, normalisation and web consultation, with sub-second response times and zero synchronisation errors.
- Procedure choice based only on experience: the ML model compares the aberrometric profile and clinical history with thousands of cases to propose the most consistent procedure indication, always leaving the final decision to the doctor.
Our technology
- Interactive viewer in the browser (no installation): explore individual Zernike modes and their combination in 3D maps, ideal for training doctors and technicians, clinical marketing and validation of algorithms before integration into devices.
- Enterprise medical software: connectors to diagnostic instruments, acquisition and normalisation pipelines, centralised database, REST APIs, exam dashboards / single exam, multi-site management, scalable cloud hosting.
- Decision-support AI: classification of patient data, refractive indices calculated in real time, statistics and predictive models for the procedure indication (wavefront-guided vs. wavefront-optimised LASIK, custom lenses, cataract IOLs).
ROI and business impact
- Clinical capacity: in the GRI case, +15% of visits manageable per day thanks to data available in real time and faster retrieval of clinical information.
- Quality and risk: zero synchronisation errors between sites, immediate calculation of indices for the procedure, fewer acquisition errors — fewer repeat examinations, fewer disputes, more patient trust.
- Commercial differentiation: offering personalised LASIK, high-definition lenses and wavefront-guided cataract surgery positions the clinic in the premium segment, with higher-value treatments and better night-vision outcomes.
- For device manufacturers: a Zernike visualisation and analysis module that can be integrated via API into aberrometers, topographers and diagnostic suites, usable via browser on kiosks, workstations and clinical portals.
Do you have a clinic, a machine or a diagnostic management system to enhance with wavefront technology?
We bring aberrometric maps, Zernike polynomials and AI into your clinical workflows — as already done with the Gruppo Refrattivo Italiano. See the case in Projects or open the full case sheet.
Request a clinical demoChoose an option: Process Analysis - Request an Audit - Talk to a System Architect

Click on the image to start the simulation. Each cell evolves only on the basis of its neighbours: a few local rules generate shapes, fronts and saturations visible across the whole grid (blue background, green structures).
Draw with the mouse or with your finger directly on the grid to trigger a reaction: the Mouse Intensity slider controls how much the brush “pushes”. Use Cycle to make the system evolve step by step and Reset to clear everything and start again.
The 10 presets at the bottom left — Standard, BZ Reaction, Cell Division, Vanishing Spheres, Deformation and Expansion 1/2, Irregular Maze, Coarse/Very Coarse Network, Small Maze — remain available in the interface to explore scenarios, congestion, propagation, saturation, flows, local interactions and emergent behaviours with different rules. The same grid with different rules produces different patterns: the goal here is to observe emergent dynamics, not to replicate your business process yet.
The demo shows the principle of cellular automata through a reaction-diffusion (Gray-Scott) model. In an industrial application, the same logic is adapted to the real process, defining the states, rules, constraints, capacities and behaviours specific to the system to be simulated.
The model shown is a representation of the principle. For industrial applications we build rules, states and constraints specific to the process to be simulated.
Technical parameters of the demo — F, K, Du, Dv, FPS
These parameters control the Gray-Scott demo and are visible at the bottom of the simulation. They do not describe your process, but they help to understand how small changes in rules generate different patterns.
- F (feed) and K (kill): feed and removal rates that determine the shape and stability of the pattern.
- Du, Dv: diffusion coefficients of the two substances.
- FPS: frames per second, an indicator of smoothness in the browser.
The business narrative instead follows: Capacity → Rules → Scenarios → KPIs → Decision.
1. The problem
Queues, saturated buffers, intersections, congestion and bottlenecks often do not depend on a single error, but on the interaction of many local decisions. A small change in a rule or layout can propagate and block the entire system. Without simulation, you only find out in the field, with downtime and costs.
2. How it works
Each cell represents a position, an area or a resource (storage, workstation, machine, person, portion of floor space). Rules describe how the system evolves by looking only at neighbours. Local interactions produce an observable global behaviour: queues, waves, gaps, saturations. It is lightweight, fast, explainable and runs in the browser with no installation.
3. Interactive demo — what you are seeing
The demo on the left is a principle, not an industrial simulator that is already ready. The Gray-Scott engine generates natural patterns to show diffusion, clogging and occupancy in real time. To move to your reality, we replace the chemical rules with your operating rules, capacities and constraints.
4. What you can simulate
- Warehouses — aisles, racks, loading bays, corridors
- Production lines and buffers between stations
- AGV fleets, forklifts and transfer cars on a grid
- People flows — departments, picking, transit and evacuation areas
- Propagation of delays, defects or information in patches
- Systems with shared resources and conflicts between flows
5. Input → Simulation → Output
| Business input | Simulation | Output |
|---|---|---|
| Layout | Flows on the grid | Critical zones |
| Cycle times | State evolution | Bottlenecks |
| Buffer capacity | Saturation | Sizing |
| Priority rules | What-if scenarios | KPI comparison |
| AGV flows | Congestion | Routes and times |
Turn an abstract technology into an understandable process: same grid, same initial conditions, different rules → objective comparison between alternatives.
6. Business problems we solve
For Operations, Manufacturing and Logistics Managers and technical leads — framework Problem → Simulation → KPI → Decision.
- AGV congestion / conflicts between flows → we simulate intersections and priorities on the grid → KPI: number of conflicts, waiting time, distance travelled → you decide routes, precedence rules and number of AGVs.
- Buffer saturation and queues between stations → we simulate capacities and cycle times → KPI: average/maximum queue length, buffer saturation, WIP → you decide buffer and decoupling stock size.
- Warehouse layouts that work on paper but not in the field → we simulate rack/aisle arrangement → KPI: resource utilisation, occupancy density, missions → you decide the new layout before moving anything.
- Propagation of delays and bottlenecks → we simulate diffusion step by step → KPI: affected stations, Lead Time, recovery time after an anomaly → you decide where to add checks or stock.
- Pedestrian flows and saturation of shared resources → we simulate crowding and gates → KPI: crowding, crossing times → you decide shifts, signage and safety procedures.
- Demand increase scenarios (+20%) → we simulate growing traffic → KPI: Throughput, Lead Time, utilisation → you decide capacity limits and investments.
7. What you measure — decision-oriented KPIs
Every KPI is compared between the current scenario and alternatives. We do not promise percentages in advance: the benefit emerges from the quantitative comparison on the same KPIs.
8. Industrial case — congestion in a warehouse
What-if questions we answer:
- What happens if I increase traffic by 20%?
- What happens if I move this buffer?
- What happens if I change the priority at the intersection?
- What happens if I introduce a new AGV?
- Where does congestion form and what is the capacity limit of the system?
9. When to use it / when not to use it
Ideal for
- spatial/discrete systems
- congestion and propagation
- flows with many local entities
- what-if scenario analysis
- emergent phenomena
- dynamic systems based on local rules
Not the ideal tool for
- high-precision FEM
- high-fidelity CFD
- specialist continuous physical simulations
- problems that require different mathematical models
Cocce does not use Cellular Automata for everything: we choose the model best suited to the problem. This selectivity is part of the value.
10. From simulation to business software
The model can be turned into a module that can be integrated into dashboards, MES, WMS, planning systems or digital twins, with parameters and KPIs fed by real data. A what-if born in the browser thus becomes an everyday decision-making tool for IT/OT and digitalisation managers: documented APIs, lightweight execution, integration with your layout, time and capacity data.
11. ROI and value — how we measure it
We avoid generic promises such as “X% cost reduction”. The benefit is estimated by comparing the current scenario with alternative scenarios on the same KPIs (Throughput, WIP, Lead Time, saturation, conflicts, distances).
- Quantitative comparison between configurations with the same initial conditions.
- Scenario ranking with tabular KPIs and saturation heatmaps.
- Economic estimate derived from KPI deltas (hours recovered, additional missions, saturation avoided), not from predefined percentages.
- Path with Cocce: real grid → operating rules translated into automaton rules → compared scenarios → KPI ranking → only the best move on to field testing or implementation.
Do you have a process with queues, congestion or saturation?
We can turn it into a what-if model and compare alternative scenarios before intervening in the real process.
Contact us and simulate your processChoose an option: Process Analysis - Request an Audit - Talk to a System Architect
All the parameters, presets and visualisations of the demo run in the browser across thousands of cells in real time. From demo to industrial project the step is short: the rules change, not the ability to simulate and compare.

Click on the image to start the interactive simulation. Observe the golden spiral and the decomposition into golden rectangles: each square is a parametrisable Fibonacci module that builds the sequence step by step.
Interact with the controls to grow the sequence and compare the golden ratio (φ 1.618) and Fibonacci modules: the same geometric structure generates different configurations to be evaluated on KPIs.
Use the view to compare configurations: layouts, patterns and distributions are generated and measured on surface used, residual waste and uniformity, not assumed to be efficient in advance.
Value for your company
- In this context the golden ratio is not considered a magic formula, but a geometric criterion to be used to generate and compare different configurations. The golden ratio (1.618) and the Fibonacci sequence, recurring in many natural phenomena, thus become mathematical tools applicable to the design of spaces, materials and production processes.
- The system generates and compares configurations based on golden ratios and Fibonacci modules, evaluating their effectiveness through industrial KPIs defined with the company: waste percentage, surface used, occupied volume, pallet positions, distance travelled, cycle time, WIP and OEE. Efficiency is therefore not taken for granted: it is verified through data.
- The goal is to turn a geometric principle into concrete and measurable choices, moving from simulation to layout definition and quantitatively comparing the current configuration with the alternatives generated.
What we solve
- Material waste: sheet metal, wood, fabric, glass or PCB are often laid out according to practical criteria that may leave material unused. The engine generates and compares nesting patterns taking into account real constraints, such as part geometry, orientation, kerf, margins and machine capacity, to assess surface used and residual waste.
- Under-utilised warehouses and racking: a non- optimised arrangement of aisles, pallets and load units can occupy more space than necessary and increase handling. The system compares different configurations, including those based on golden ratios and geometric modules, considering pallet positions, occupied volume, storage density and distance travelled.
- Unbalanced lines and workstations: an uneven distribution of activities can create bottlenecks, waiting and different workloads between operators and machines. Splits and distances are parameterised to compare cycle times, WIP and OEE and identify more balanced configurations.
- Batch planning and rigid sampling: the use of fixed batches and linear increments can lead to suboptimal stock levels or stockouts. The Fibonacci progression can be used as modular logic for building growth, sizing, sampling or release scenarios (1, 1, 2, 3, 5, 8...), adapting it to the characteristics of the process and to capacity, demand and service level constraints.
Our technology
- The demo shows in real time golden rectangles, logarithmic spiral and square modules based on the Fibonacci sequence. These elements are used as a basis for generating different geometric configurations, which can be modified and compared. The goal is not to promise perfect nesting, but to provide a concrete way to assess surface utilisation and residual spaces as constraints vary.
- The engine calculates golden ratios and Fibonacci sequences and applies them to different industrial scenarios. The sunflower-type spiral arrangement, for example, can be used to define the positioning of sensors, nozzles or holes, assessing coverage, distance, uniformity and application-specific constraints. Likewise, golden proportions can be used in the subdivision of racks, HMI windows and ergonomic workstations.
- A lightweight, deterministic and easily interpretable algorithm, running directly in the browser and integrable via API with configurators, WMS, CAM nesting systems and dashboards for line balancing. The process remains transparent: configurations are generated, compared and evaluated on the basis of parameters and measurable results.
- The system can produce a layout specification made up of coordinates, steps, dimensions and scale factors, usable as input for CAD, nesting systems, WMS, configurators and handling systems. The result is a structured design basis, designed to be compared and verified before implementation.
ROI and business impact - how we measure it
- A methodology based on data, not on numerical promises: we start from the current configuration, generate alternatives through the parametric engine and subject them to simulation or testing. Comparing the KPIs therefore makes it possible to estimate the economic benefit on the basis of real company data.
- Nesting and cutting: we compare waste percentage, used surface and number of parts per sheet or coil between the current layout and the generated configurations. The possible raw material saving can then be translated into a cost per order and an annual estimate.
- Warehouse and palletisation: we assess pallet positions, volume occupied, load unit saturation, AGV missions and required handling operations. In this way it is possible to compare different storage configurations before physically intervening in the warehouse.
- Line balancing and lean layout: cycle times, waiting, WIP and OEE are compared between different configurations to identify solutions capable of making the flow more uniform, keeping process constraints unchanged.
- Modular planning: scenarios based on the Fibonacci progression can be simulated for batches, releases and quality sampling, assessing their effects on turnover, coverage and service level and identifying the progression best suited to the relationship between demand and production capacity.
- Product, packaging and HMI: golden proportions can be used as a design parameter for packaging, displays and interfaces. The different solutions are then assessed on the basis of material utilisation, footprint, operator errors and pick times, verifying with the KPIs whether the proposed configuration actually brings an advantage.
Do you want to turn geometries and proportions into measurable advantages for your company?
We generate and compare configurations based on the golden ratio and Fibonacci sequences, assessing them through industrial KPIs and real constraints.
Analyse configurations with usChoose an option: Process Analysis - Request an Audit - Talk to a System Architect
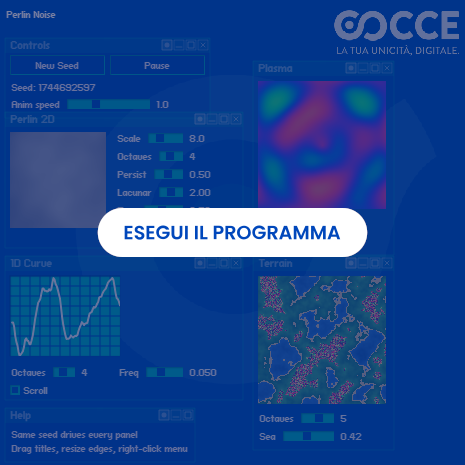
Press New Seed to generate a new scenario: all 4 panels regenerate in a coordinated and deterministic way. With the same seed, parameters and algorithm, the result is reproducible and the validation repeatable.
Perlin 2D: procedural texture for materials (wood, metal, ceramic). Plasma: continuous procedural field for spatial distributions (temperature, coating). 1D Curve: synthetic scenario with temporal correlation (demand, cycle times, wear). Terrain: surface with threshold for traversability tests and accept/reject logic.
Adjust the sliders to control intensity, scale, detail and frequency: this calibrates the level of variability to include in textures, data and simulations.
Value for your business
- Perlin Noise is an algorithm used to generate natural and continuous variations. It is particularly useful when a system must simulate something that, in the real world, is not perfectly uniform: a surface, a material, a signal or a production process.
- Procedural materials and surfaces: It can be used to generate textures and visual variations such as wood grain, roughness, porosity, wear or surface imperfections. In this way it is possible to create procedural materials to use in rendering, product configurators and simulations.
- Synthetic data for computer vision systems: Procedural noise lets you introduce controlled variations in images and surfaces, simulating defects, scratches, wear or other anomalies. This can be useful to expand the available datasets and test inspection systems even in the presence of conditions that are difficult to collect directly on the production line.
- More realistic variability in simulations: Unlike simple random noise, Perlin Noise generates continuous and correlated variations. For this reason it can be used to simulate phenomena that change gradually over time or space, such as variations in demand, cycle times, degradation of components or environmental conditions.
What we solve
- Managing product variants: When every finish or variant requires new images or new renderings, updating catalogues and configurators can become slow and costly. Procedural materials instead let you generate numerous variants from a few parameters.
- Few examples of real defects: Some defects are rare, but they can have major consequences on product quality. Collecting a sufficient number of real examples can require a lot of time; synthetic generation lets you create additional scenarios for testing and training systems.
- Simulations too far from reality: Planning a production line using only average values can hide problems that emerge only when variations increase in times, demand or machine performance.
- Tests run only under ideal conditions: Control algorithms, filters and predictive systems must deal with imperfect data and noisy signals. Simulating these conditions before real use makes it easier to identify any critical issues.
Our technology
-
Four representations of the same algorithm: the interactive example
shows how Perlin Noise can be used in different contexts,
through four visualisations linked to each other by the same
seed.
Perlin Noise 2D: used to represent textures, surfaces and materials.
Plasma: useful for visualising continuous and dynamic fields, for example temperature variations or material distributions.
1D Curve: shows how procedural noise can represent time series such as demand, cycle times or degradation.
Terrain with threshold: used to simulate surfaces, operating conditions and accept or reject logic. - Reproducible results: using the same seed always produces the same result, making scenarios easier to compare, document and use during repeated tests.
- Parameters adjustable in real time: scale of variations, level of detail and signal persistence can be adjusted to move from almost regular scenarios to far more variable conditions.
- Lightweight and integrable: the algorithm can run directly in the browser and be integrated into simulators, dashboards, configurators and other interactive tools.
ROI and business impact
- Product configurators and catalogues: Materials and finishes can be generated procedurally, simplifying the management of numerous variants and speeding up the creation of new configurations.
- Quality control and computer vision: Generating synthetic scenarios can help integrate the available real data, creating additional conditions for testing and training inspection systems.
- Digital twins and production planning: Simulating realistic variations lets you assess how a line behaves not only under ideal conditions, but also when times, demand and performance change.
- Simulation of terrain and operating environments: Procedurally generated terrain profiles can be used for virtual tests of vehicles, agricultural machinery, construction equipment and autonomous systems before physical trials are carried out.
- Repeatable and documentable tests: The ability to regenerate exactly the same scenario lets you compare different versions of an algorithm or system using identical conditions.
Do you want to test your systems under variable and realistic conditions?
We generate reproducible synthetic scenarios for materials, computer vision and digital twins, so that you can verify how systems behave before testing them in the factory.
Let's talk about your projectChoose an option: Process Analysis - Request an Audit - Talk to a System Architect

Select one of the 4 presets — Reaction, Lifetime, Waiting, Default — to explore typical scenarios of reaction time, useful life, waiting and general configuration.
Drag the red vertical line in the chart to move the threshold: the highlighted area shows the probability P(X ≤ threshold).
Adjust the Threshold stepper to set the value precisely; the chart updates in real time.
Value for your business
- The interactive example shows how the Wald distribution (or inverse normal) estimates the probability that an event occurs within a defined threshold: reaction times, lifetime, waiting times or other positive variables.
- Dragging the threshold immediately gives P(X ≤ threshold), turning a statistical concept into an operational indicator for technicians, managers and stakeholders.
- The four presets — Reaction, Lifetime, Waiting, Default — cover the most common cases: validation tests, reliability, service level and generic modelling.
What we solve
- Difficulty in communicating risk: technicians and managers do not always translate a statistical distribution into an operational probability; the interactive threshold makes it immediately understandable.
- Planning on averages: deciding on the mean alone hides the probability of extreme events, such as early failures or critical delays.
- Assessing service thresholds: defining service levels, maximum response times or warranty deadlines without robust quantitative support.
Our technology
- Interactive simulation with 4 presets (Reaction, Lifetime, Waiting, Default) to cover the main industrial time modelling scenarios.
- Drag synchronised with the Threshold stepper: every change to the threshold updates the highlighted area and the probability P(X ≤ threshold) in real time.
- Can be integrated into dashboards, BI systems, predictive maintenance and supply chain planning to bring probabilistic calculation directly into operational decisions.
ROI and business impact
- Predictive maintenance: defining the probability of failure within a time horizon to plan interventions and spare parts stock with less waste.
- Service level and customer care: estimating the probability of responding within a time threshold, improving SLAs and customer satisfaction.
- Warranty and R&D: assessing lifetime, reaction or waiting times in validation tests and product specifications.
- Supply chain: reducing buffers and safety stock by realistically modelling lead times and waiting times.
- Finance and insurance: quantifying risk within time or amount thresholds for pricing, provisioning and risk management.
Do you need to estimate the risk of failures, delays or events within a time threshold?
We model probabilities using the Wald distribution to support maintenance, reliability and supply chain, turning statistical estimates into operational decisions.
Analyse your process riskChoose an option: Process Analysis - Request an Audit - Talk to a System Architect

Interact with the simulation to visualise the Bresenham algorithm applied to grid path finding.
Observe how the algorithm computes the optimal path pixel by pixel, demonstrating its computational efficiency.
Value for your business
- The Bresenham Line Algorithm is the mathematical foundation of path finding on a discrete grid used in robotics, AGVs, navigation systems and warehouse automation.
- An optimal path on a grid means more efficient movements, shorter travel times and lower energy consumption for machines and robots operating in structured environments.
- Our algorithms turn path planning into a measurable competitive advantage, integrable into any automated handling system.
What we solve
- Inefficient grid movements: robots and AGVs that follow non-optimal paths consume more energy and take more time to move between points.
- Collisions and congestion: without accurate planning, more autonomous vehicles in the same area create conflicts and blockages.
- Approximate implementations: imprecise pathfinding algorithms create zig-zag trajectories, mechanical wear and floor wear.
Our technology
- Implementation of the Bresenham algorithm with optimisations for grid path finding, computing the path with integer arithmetic only - zero floating point, maximum efficiency.
- Integrable on microcontrollers, PLCs, embedded systems and industrial PCs for real-time motion control applications.
- Combines geometric precision with navigation heuristics to generate smooth, optimal paths in environments with obstacles.
ROI and business impact
- Greater AGV efficiency: 15-25% - automated guided vehicles follow optimal trajectories, reducing cycle times and consumption.
- Industrial robotics: grid trajectory planning for robotic arms, pick-and-place and welding.
- Warehouse logistics: optimal paths for transfer cars, shuttles and automated carts between racks and bays.
- Factory automation: precise, repeatable movements for machine tools, engravers and industrial plotters.
- Embedded systems: ultra-lightweight implementation that runs on low-cost hardware for IoT and machine-edge applications.
Do you want to make your robots' and handling systems' paths more efficient?
We design grid navigation algorithms for robotics, AGVs and internal logistics, with the aim of reducing travel times and inefficient movements.
Optimise your company's pathsChoose an option: Process Analysis - Request an Audit - Talk to a System Architect

Interact with the simulation to observe raycasting and flood fill applied to real-time shadow calculation.
Experiment with different light and obstacle configurations to understand how the lighting behaves.
Value for your business
- Lighting and shadow simulation with raycast and flood fill underpins architectural design, industrial rendering, product visualisation and computer vision systems.
- Predicting digitally how light and shadows interact with an environment lets you optimise the lighting of plants, offices and commercial spaces before installing a single light point.
What we solve
- Costly lighting projects: installing luminaires without knowing exactly how they will perform, with subsequent adjustment costs.
- Costly rendering and prototyping: every lighting variant requires a new rendering or a physical mockup.
- Unoptimised computer vision: optical inspection systems that fail because of uncontrolled lighting conditions.
Our technology
- We use raycasting to trace light rays from point sources, combined with flood fill to determine shadow and penumbra areas efficiently.
- The simulation computes in real time the environment's visibility map, distinguishing lit, shaded and partially covered areas.
- Integrable into design, architecture and computer vision software for accurate simulations without dedicated hardware.
ROI and business impact
- Lighting design cost reduction: 30-50% - simulate dozens of light configurations before installing anything physically.
- Energy savings: design of optimised lighting systems that minimise consumption while maintaining target illuminance.
- Architecture and interior design: study of the impact of natural and artificial light in commercial spaces, offices and showrooms.
- Automotive and product design: lighting simulation on surfaces and materials to assess aesthetic appearance and visibility.
- Video games and interactive experiences: dynamic lighting systems for immersive virtual environments, trade fairs and installations.
Do you want to simulate lighting and identify critical issues before carrying out the project?
We simulate light, shadows and obstacles to assess different configurations in real and virtual environments, before investing in physical installations and prototypes.
Simulate your project with usChoose an option: Process Analysis - Request an Audit - Talk to a System Architect

Interact with the simulation to observe the dynamic behaviour of fluids and their interactions with obstacles and boundaries.
Experiment with different configurations to understand the principles of flow, pressure and turbulence.
Value for your business
- Computational fluid dynamics is essential in countless industrial sectors: aerospace, automotive, oil & gas, chemical, food, HVAC - wherever a fluid (liquid or gas) interacts with a product or a process.
- Simulating fluid behaviour digitally means reducing physical prototypes, accelerating product development and optimising energy efficiency with an immediate ROI.
What we solve
- Costly physical tests: wind tunnels, test tanks and hydraulic circuits require million-euro investments and long lead times.
- Design without fluid dynamics feedback: shapes and ducts designed without simulation generate turbulence, pressure losses and inefficiencies that are only discovered once the prototype is finished.
- Incorrect sizing: pumps, valves, pipes and heat exchangers that are oversized or undersized, with higher energy and maintenance costs.
Our technology
- The simulator uses the Lattice Boltzmann method (LBM) to model the fluid as a set of particles that move and collide on a discrete grid - a parallel and numerically stable approach.
- It supports internal obstacles, variable boundaries and multiple sources, making it possible to model realistic industrial scenarios such as ducts, mixing chambers and aerodynamic profiles.
- Real-time visualisation with velocity, pressure and vorticity maps for immediate feedback on design changes.
ROI and business impact
- Physical prototype reduction: 40-60% - simulate hundreds of geometric variants before the first real prototype.
- Automotive and aerospace aerodynamics: optimisation of the drag of vehicles, drones and aeronautical components.
- Oil & gas and chemical: flow simulation in pipes, valves, reactors and exchangers to reduce pressure losses and improve process efficiency.
- HVAC and climate control: design of ventilation, air conditioning and air handling systems with optimal flow distribution.
- Food and pharmaceutical industry: modelling of flows in tanks, mixers and filling lines to ensure homogeneity and product quality.
Do you want to optimise fluid behaviour in your products or industrial processes?
We simulate flows, pressures and turbulence to analyse different configurations and identify design critical issues, before building physical prototypes and plants.
Analyse your fluid dynamics projectChoose an option: Process Analysis - Request an Audit - Talk to a System Architect
Row 1: RandomPath (generates a random path), NearestNeighbor (greedy path), Best (SA) (optimisation with Simulated Annealing).
Row 2: All Cities (uses all Italian cities), Sample Cities (reduced sample for greater clarity).
Row 3: Cities On/Off button to show or hide the city points - disabling it makes the traced route easier to see, especially with many cities.
Row 4: Pause (stops/resumes execution - the label stays "Pause"), Restart (regenerates a new path).
Value for your business
- Route optimisation is one of the most effective levers for reducing operating costs in any organisation that manages fleets, service calls or journeys.
- Our algorithms solve the travelling salesman problem (TSP) at industrial scale, planning routes that minimise time, distance, fuel consumption and vehicle wear.
- The result is a measurable saving of 15% to 25% on transport and logistics costs, with a return on investment within a few months.
What we solve
- Manual or experience-based planning: your drivers or dispatchers plan routes "by feel", generating paths that are suboptimal and pile up unnecessary kilometres and hours.
- Exponential complexity: with more than 15 points to visit, the number of possible routes becomes astronomical - impossible to manage without advanced algorithms.
- Real-world constraints ignored: time windows, delivery priorities, vehicle capacity, restricted traffic zones and differentiated per-leg costs are handled automatically by our optimiser.
Our technology
- We use Simulated Annealing, a metaheuristic that explores the solution space intelligently, accepting temporary suboptimal moves to escape local minima and converge on the globally best route.
- The algorithm runs on representative samples (e.g. 100 stops out of 16,000 Italian cities) and is iterated several times to ensure the robustness of the result.
- Integrable via API into your ERP, MES or fleet management platforms, with computation times compatible with daily planning.
ROI and business impact
- Fuel reduction: 15-25% - shorter, optimised routes cut fuel costs and CO₂ emissions.
- More deliveries/vehicles/hour - the same fleet covers more stops in the same time, increasing revenue without investing in new vehicles.
- Less overtime - drivers return to base earlier, reducing driving hours and stress.
- Reduced maintenance - fewer kilometres driven means less wear on tyres, brakes and engines.
- In-plant logistics: optimal routes for AGVs, forklifts and carts between warehouse and production lines, reducing downtime.
- Industrial robotics: optimal trajectories for welding, painting and pick-and-place, with shorter machine cycles and greater productivity.
- Supply chain and distribution: optimal planning of collection, delivery and goods rotation tours between hubs and retail outlets.
Do you want to reduce the kilometres, time and cost of your deliveries?
We optimise fleet and distribution routes using advanced planning algorithms to improve logistics efficiency and make the best use of available vehicles.
Optimise your logistics routesChoose an option: Process Analysis - Request an Audit - Talk to a System Architect

Drag the control points or the anchors to modify the curve.
Select the type of action you want to perform in the left-hand column.
Use the "Random" button to start a random configuration of the agents.
Use the "Reset" button to reset the simulation data.
Select the type of action you want to perform in the left-hand column.
Value for your business
- Bézier curves are the mathematical foundation for generating smooth, precise trajectories in manufacturing: from robotics to CNC machines, from laser cutting to 3D printing.
- An optimised trajectory means less vibration, reduced jerk, faster machining and superior surface quality - everything translates into less scrap, higher productivity and lower costs.
- Cocce integrates these technologies into motion control and CAD/CAM customised for your machines and processes.
What we solve
- Cornered trajectories: abrupt movements cause mechanical wear, vibration and poor finishes on machined parts.
- Manual path programming: technicians waste hours writing G-code or motion instructions, with suboptimal results.
- Lack of simulation tools: without a visual editor, every change requires costly and risky physical tests.
Our technology
- Implementation based on the de Casteljau algorithm and Bernstein polynomials, with real-time computation and Canvas rendering for immediate feedback.
- Multi-degree support (linear, quadratic, cubic and higher) to suit different path flexibility requirements.
- Integrable into enterprise numerical control, robotics and CAD/CAM systems.
ROI and business impact
- Machine cycle time reduction: 10-20% - optimised trajectories allow higher machining speeds without sacrificing quality.
- Less scrap and rework - the smoothness of the path eliminates surface defects and out-of-spec tolerances.
- Reduced machine wear - controlled jerk and acceleration extend the life of spindles, bearings and tooling.
- Industrial robotics: smooth trajectory planning for robotic arms, reducing cycle times and improving precision.
- Manufacturing industry: optimised tool paths for CNC, laser cutting and 3D printing: the quality of the finished part starts with the trajectory.
Do you want to improve the precision and smoothness of your machines' trajectories?
We design parametric trajectories for robotics, CNC and CAD/CAM systems, with the aim of reducing abrupt movements, vibration and machining times.
Optimise your systems' trajectoriesChoose an option: Process Analysis - Request an Audit - Talk to a System Architect
Select the type of waveform to analyse from the dropdown.
Set the number of points of the waveform manually or with the buttons at the bottom edge of the simulation.
Restart the calculation using the "Compute" button.
Value for your business
- The Fast Fourier Transform (FFT) is the mathematical tool behind industrial predictive maintenance: it analyses the vibrations of rotating machinery to detect anomalies before they cause production stoppages.
- An unexpected failure on a critical machine can cost tens of thousands of euros per hour. FFT makes it possible to detect bearing wear, imbalance, misalignment and other defects early, turning raw sensor data into actionable diagnostics.
What we solve
- Calendar-based maintenance: you replace components that still work, spending money on unnecessary spare parts and labour.
- Sudden failures: without spectral analysis, a worn bearing stops the line without warning, causing huge production losses.
- Diagnostics left to experience: experienced technicians retire and the know-how goes with them - FFT makes diagnosis objective and reproducible.
Our technology
- Implementation of the Cooley-Tukey algorithm with O(n log n) complexity, capable of processing signals in real time on low-power embedded devices.
- Multi-waveform analysis (sine, triangle, sawtooth, square, pulse) to cover different vibration diagnostics scenarios.
- Side-by-side time/spectral domain visualisation for an immediate comparison between raw signal and frequency components.
- Integrable on IoT gateways, PLCs, industrial PCs and the cloud for continuous 24/7 monitoring.
ROI and business impact
- Machine downtime reduction: 30-50% - predictive maintenance anticipates failures and lets you schedule stoppages at times of least production impact.
- Spare parts savings: 20-30% - components are replaced only when genuinely necessary, not on a fixed schedule.
- Quality control and testing: harmonic analysis of mechanical components to verify compliance with production standards.
- IoT and smart sensors: real-time processing of vibration data directly on embedded devices, with no need to send everything to the cloud.
- Telecommunications: bandwidth and modulation analysis for LTE, Wi-Fi and DVB-T networks.
Do you want to detect anomalies in machinery before they cause production stoppages?
We analyse vibration signals using the Fast Fourier Transform to identify anomalous frequencies and support diagnostics, turning sensor data into information useful for maintenance.
Discover the potential of predictive diagnosticsChoose an option: Process Analysis - Request an Audit - Talk to a System Architect

Click anywhere on the grid to add a new experimental point, or drag an existing point to adjust its position in real time.
Change the polynomial degree to define its behaviour.
Use the "Random" button to instantly generate a random configuration of points distributed across the plane.
Use the "Clear" button to empty the chart completely.
Use the "Remove" button to delete a selected point or the last point added to the chart.
Use the "Add" button to add a random point to the chart.
Value for your business
- Curve Fit turns raw data into mathematical models that can be used to predict behaviour, optimise parameters and control quality in real time.
- Every company generates mountains of experimental data: temperatures, pressures, speeds, cycle times. Without a mathematical model to describe them, this data remains unused information. With polynomial fitting it becomes industrial know-how.
What we solve
- Trial-and-error optimisation: you set production parameters by eye or by trial and error, with inconsistent results and material waste.
- Unmodelled data: you collect data but do not use it to predict the effect of process variables on product quality.
- Overfitting/underfitting: without the right tools you risk models that are too complex (fitting the noise) or too simple (losing the signal).
Our technology
- The fitting uses singular value decomposition (SVD) to solve the overdetermined linear system, ensuring numerical stability even for high-degree polynomials.
- Model quality is quantified using R² and RMSE, allowing an objective comparison between different modelling hypotheses.
- Simultaneous display of original points, fitted curve and confidence bands for immediate evaluation.
ROI and business impact
- Process parameter optimisation: fewer scraps and reworks by finding the ideal operating point (temperature, pressure, speed).
- Quality analysis and control: modelling of calibration curves for measuring instruments and industrial sensors, with full traceability.
- Research and development: fitting of experimental data to extract physical, chemical or biological parameters from laboratory measurements - fewer physical tests, more simulations.
- Energy and sustainability: modelling of production curves for photovoltaic or wind plants to forecast energy yield.
Do you want to turn production data into models that improve quality and efficiency?
We model experimental data to identify relationships between variables, evaluate process parameters and compare scenarios, supporting decisions with measurable mathematical models.
Analyse your process dataChoose an option: Process Analysis - Request an Audit - Talk to a System Architect

Drag any point of the cloth to alter its behaviour.
Click the "Cut" button to enable the cutting function.
Clicking on the cloth while in this mode will create
holes in it.
Use the "Reset" button to reset the simulation data.
Value for your business
- Cloth Simulation models deformable materials as meshes of interconnected particles, making it possible to digitally simulate the behaviour of fabrics, membranes and flexible materials before building physical prototypes.
- In industry, this technology applies to textile engineering, automotive (upholstery), furniture, soft robotics and surgical simulations - wherever the behaviour of deformable materials must be predicted.
What we solve
- Costly physical prototyping: every change to a fabric, upholstery or membrane requires real prototypes, with long lead times and high costs.
- Unpredictable behaviour: without simulation, you only find out at the assembly stage whether a material behaves as intended.
- Long iterations: the design-prototype-test cycle takes weeks for every variation.
Our technology
- Verlet numerical integrator to update particle positions and velocities with good stability and low computational cost.
- Elastic constraints solved iteratively with Projection Constraints, ensuring correct distances between particles and the material structure.
- Spatial grid to optimise collision detection, ensuring smooth performance even for high-resolution meshes.
ROI and business impact
- Physical prototype reduction: 50-70% - digitally simulate dozens of material variants before producing the first real sample.
- Reduced time-to-market: the development cycle for new textile or upholstery products drops from weeks to days.
- Automotive and furniture: virtual modelling of upholstery, soft furnishings and technical fabrics for vehicle interiors and furniture.
- Soft robotics: design and simulation of flexible actuators and grippers in deformable materials.
- Architecture and design: simulation of tensile structures and architectural membranes for civil engineering projects.
Do you need to design a flexible material without multiplying physical prototypes?
We simulate the behaviour of fabrics, upholstery and membranes to test deformations, constraints and interactions before production, reducing development costs and time.
Simulate your materialChoose an option: Process Analysis - Request an Audit - Talk to a System Architect

Use the "Restart" button to restart the simulation from scratch.
Use the "Random" button to start a random configuration of the agents.
Use the "Clear field" button to empty the field and start again from an empty grid.
Use "Pause" to stop the run and "Step" to advance frame by frame.
Adjust the "Speed" slider to change the agents' update speed.
Change the number of "Agents" to increase or decrease the size of the swarm.
Use "Zoom" (click + drag) and the mouse wheel to navigate the grid.
Value for your business
- The Swarm Intelligence is a decentralised multi-agent system in which hundreds of autonomous entities explore and cover an area without centralised control - the same logic that allows drone swarms, robot fleets and automatic coverage systems to operate with efficiency and robustness.
- The approach is extremely scalable and fault tolerant: if an agent fails, the others keep operating. The more agents are added, the faster the task is completed.
What we solve
- Complex centralised coordination: managing every unit of a fleet individually becomes impossible as the number of agents grows.
- Fragile systems: a centralised system stops if the central server fails. With a swarm there is no single point of failure.
- Inefficient coverage: without dispersal logic, more units can overlap, wasting resources and time.
Our technology
- A population of autonomous agents operating in parallel on a discrete grid, updating position and state in a high-frequency simulation loop.
- Each agent applies local heuristics to maximise the distance from its neighbours (dispersal) and minimise overlaps, generating patterns of blue noise distribution.
- No agent has a global view: emergent behaviour derives exclusively from local interactions, just as in natural swarms.
ROI and business impact
- Automated warehouses: robot fleets for picking and handling that coordinate autonomously, reducing bottlenecks.
- Precision agriculture: uniform coverage of the land for spraying, monitoring and harvesting using drone swarms.
- Industrial inspection: drones that autonomously explore and map large areas (plants, tunnels, mines) without central guidance.
- Defence and security: coordination of robotic units for surveillance of vast or hazardous areas.
- Automatic cleaning and sanitisation: distributed robots that cover surfaces systematically without overlaps.
Do you need to coordinate robot or drone fleets without relying on centralised control?
We simulate swarms of autonomous agents to optimise coverage, distribution and collaboration between units, reducing overlaps, operational times and critical points.
Optimise your autonomous fleetChoose an option: Process Analysis - Request an Audit - Talk to a System Architect

Each particle moves autonomously and connects instantly to the other nearby points.
Use the controls to change distance, quantity, hue and speed.
Use the "Reset" button to reset the run.
Use the "Random" button to start the run with random parameters.
Value for your business
- Connections shows how network structures emerge dynamically from the simple rule of proximity - a model applicable to IoT sensor networks, connected devices, network infrastructures and multi-agent systems.
- In an industrial scenario, each particle can represent a sensor, a machine, a vehicle or a device, and the connections that activate based on distance simulate mesh networks, device-to-device communications and dynamic topologies.
What we solve
- Static networks that are hard to interpret: traditional network diagrams do not show how connections change over time.
- What-if scenario simulation: how does the network reconfigure if a node fails? Which connections activate under load?
- Communication between technicians and stakeholders: a dynamic visualisation conveys system behaviour far more effectively than a report.
Our technology
- The system models a collection of autonomous agents with position and their own velocity, updated in a rendering loop on Canvas.
- On each frame the Euclidean distance between all pairs of particles is calculated - if it is below the set radius, a connection is drawn.
- Interactive parameters (distance, quantity, speed) directly control the model variables, offering immediate visual feedback.
ROI and business impact
- IoT network visualisation: dynamic monitoring of the status of sensors and devices, with connections that change based on signal, load or proximity.
- Multi-agent system simulation: study of emergent behaviour in drone or robot swarms that interact by proximity.
- Generative design and interactive installations: creation of immersive visual experiences for trade fairs, showrooms and corporate spaces.
- Advanced user interfaces: particle systems as a reactive graphic element in web and mobile applications and interactive kiosks.
Do you want to understand how the devices in your industrial ecosystem connect and interact?
We visualise dynamic networks of sensors, machines and connected devices to analyse topologies, proximity and reconfiguration scenarios, making the links and dependencies between systems clearer.
Explore the connections in your systemChoose an option: Process Analysis - Request an Audit - Talk to a System Architect
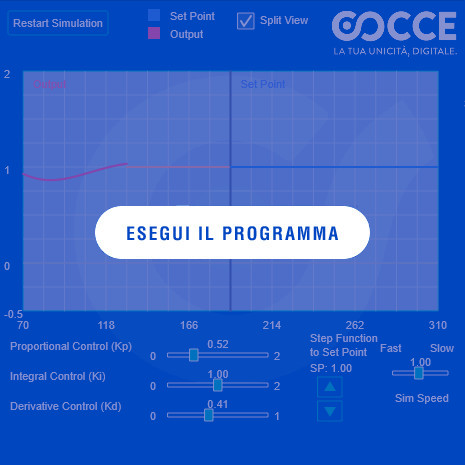
Click on "Start Simulation" to start the PID controller simulation.
Adjust the Proportional Control (Kp), Integral Control (Ki) and Derivative Control (Kd) sliders to observe the system response in real time.
Change the SP (Set Point) value with the up/down arrows to change the signal reference point.
Use the Sim Speed slider to adjust the simulation speed between Fast and Slow.
Enable Split View to display the Set Point and the Output on the graph at the same time.
Value for your business
- The PID Controller is the most widespread control algorithm in industrial automation: it regulates temperature, speed, pressure, level and hundreds of other process variables in every manufacturing sector.
- A well-tuned PID means consistent product quality, lower energy consumption, less waste and machines that last longer. A poorly tuned PID means oscillations, overshoot and out-of-spec product.
What we solve
- Manual trial-and-error tuning: technicians adjust Kp, Ki and Kd "by ear", obtaining suboptimal control that consumes more energy and generates waste.
- Parameter drift over time: a PID tuned years ago may no longer be optimal today due to mechanical wear or process changes.
- Diagnostic difficulty: when a process oscillates, is it a problem with the controller, the process or the sensors? The simulator helps you find out.
Our technology
- The controller calculates the error e(t) as the difference between setpoint and process variable, applying the three actions: proportional (immediate response), integral (elimination of steady-state error), derivative (anticipation of corrections).
- The simulation uses a dynamic model of the process to display the response realistically, with the option to introduce disturbances.
- Integrable into SCADA systems, PLCs and embedded controllers for automatic tuning and continuous optimisation of control loops.
ROI and business impact
- Energy savings: 10-25% - an optimised PID reduces oscillations and keeps the process at its point of maximum efficiency.
- Consistent product quality - the controlled variable always remains close to the setpoint, eliminating drift and out-of-spec results.
- Temperature control: industrial furnaces, air conditioning and refrigeration.
- Speed regulation: electric motors, conveyor belts and robotics.
- Industrial automation: automatic tuning of machines and production lines to guarantee quality and repeatability.
Do your industrial processes show oscillations, energy waste or out-of-spec parameters?
We simulate and optimise PID controllers to improve the regulation of temperatures, pressures and speeds, increasing process stability, efficiency and quality.
Optimise the control of your processesChoose an option: Process Analysis - Request an Audit - Talk to a System Architect
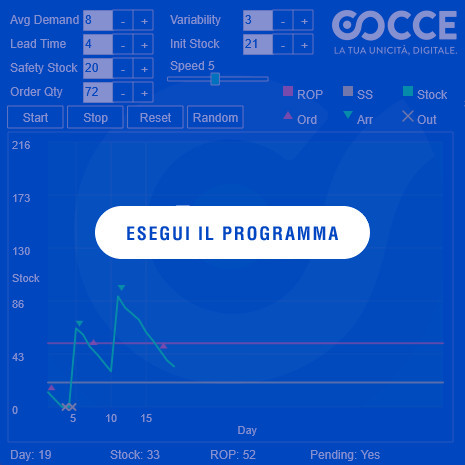
Configure the inventory management parameters: Avg Demand (average demand), Lead Time (delivery time), Safety Stock (safety buffer), Order Qty (order quantity), Variability (variability) and Init Stock (initial stock).
Adjust the Speed slider to change the simulation speed.
Use the Start buttons to start, Stop to interrupt, Reset to restore and Random to generate random parameters.
The legend shows: ROP (reorder point), SS (safety stock), Stock (on-hand stock), Ord (order in progress), Arr (goods arrival) and Out (outgoing).
At the bottom the following are displayed in real time: Day (day), Stock (current stock), ROP (reorder value) and Pending (order status).
Value for your business
- The Reorder Point (ROP) is the fundamental technique for managing stock efficiently: it determines exactly when to reorder in order to avoid both stock-outs and excess inventory.
- Every day of production downtime for lack of material costs thousands of euros. Every euro tied up in inventory is a euro that is not working for the company. ROP finds the optimal balance between these two risks.
What we solve
- Sudden stock-outs: production stops because a raw material is missing, with huge losses in terms of man-hours and machine downtime.
- Excess stock: you keep far more than necessary in the warehouse "for safety", tying up capital that could be invested elsewhere.
- Intuition-based management: orders are placed "when it looks like it is running out", with no scientific criterion, generating an alternation of stock-outs and surpluses.
Our technology
- The reorder point is calculated as ROP = (Average demand × Lead time) + Safety stock, where the safety stock depends on demand variability and the target service level.
- The simulation integrates probabilistic models to represent demand and delivery time variability.
- Results are updated in real time for every parameter change, enabling an immediate analysis of the trade-offs between cost and service.
ROI and business impact
- Stock reduction: 20-40% - by optimising reorder parameters you release tied-up capital without increasing the risk of stock-outs.
- Zero production stoppages due to missing materials - the system ensures that material always arrives before depletion.
- Supply chain and logistics: supply planning and reduction of production downtime.
- Retail and distribution: automatic calculation of reorder points for stores and distribution centres.
- Predictive maintenance: spare parts stock management based on scheduled interventions.
Do you have problems with excess stock or risks of production stoppage due to missing materials?
We optimise reorder points based on demand, lead times and variability to balance availability and stock levels, reducing tied-up capital and the risk of stock-outs.
Optimise your inventory managementChoose an option: Process Analysis - Request an Audit - Talk to a System Architect
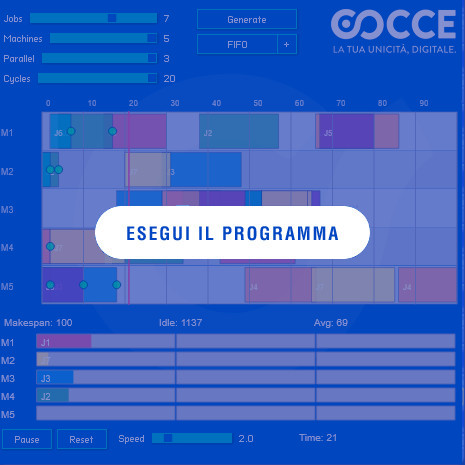
Configure the planning parameters using the sliders: Jobs (number of jobs), Machines (number of machines), Parallel (degree of parallelism) and Cycles (production cycles).
Click on "Generate" to automatically create the production plan based on the set parameters.
Select the scheduling strategy using the FIFO button (or other available policies) to change the job priority rule.
Click on "Play" to start running the simulation and on "Reset" to restore the initial state.
Adjust the Speed slider to change the simulation execution speed.
The following metrics are displayed in real time: Makespan (total completion time), Idle (idle time) and Avg (average completion time), together with the current Time value.
Value for your business
- Production Planning solves the problem of allocating limited production resources (machines, operators, materials) to meet demand, minimising times, costs and bottlenecks.
- Inefficient planning means idle machines, late deliveries, unnecessary overtime and dissatisfied customers. With our algorithms, every production resource works at optimal saturation.
What we solve
- Manual planning in Excel: the planner spends hours arranging orders on spreadsheets, with results that are already obsolete at the first unexpected event.
- Unidentified bottlenecks: without a systemic view, some machines accumulate work while others remain unused.
- Slow response to change: an urgent order or a breakdown takes hours to be replanned manually.
Our technology
- The problem is modelled as resource-constrained scheduling, solved through heuristics and combinatorial optimisation algorithms.
- Local search techniques and greedy algorithms build an initial solution, which is then refined through exchanges and re-optimisations.
- The interactive visualisation shows the plan as a Gantt chart with performance indicators: makespan, resource utilisation, delays.
ROI and business impact
- Throughput increase: 15-30% - the same factory produces more with the same resources, simply by scheduling better.
- Reduction of delivery delays - the plan meets deadlines and automatically prioritises priority orders.
- Industry 4.0: integration with MES and ERP systems for real-time planning, with immediate responsiveness to breakdowns and urgent orders.
- Moulding, machining and assembly: batch sequencing and changeover optimisation.
- Internal logistics: coordination between production and material handling to reduce lead times.
Does your production have bottlenecks, idle machines or delivery delays?
We optimise job planning and sequencing based on resources, priorities and production constraints, increasing throughput and reducing idle times.
Optimise your production planningChoose an option: Process Analysis - Request an Audit - Talk to a System Architect

Click on the grid to place the Start point (green) and the End point (red).
Click and drag to draw walls and obstacles on the grid.
Use the "Find" button to start the search for the optimal path.
Use the "Clear" button to clear the grid.
Use the "Random" button to generate random walls and place the two points automatically.
Value for your company
- The A* (A Star) algorithm is the industry standard for planning optimal paths in environments with obstacles: used in robotics, vehicles autonomous, GPS navigation and evacuation systems.
- A* combines the actual cost of the path already travelled with a heuristic estimate of the remaining distance, guaranteeing efficiency and optimality even in spaces complex with thousands of possible paths.
What we solve
- Inefficient paths: your AGVs, robots or operators follow predefined paths that do not adapt to obstacles or current conditions.
- Navigation in dynamic environments: an optimal path in the morning can be blocked in the afternoon - real-time recalculation is required.
- Manual optimisation impossible: in a warehouse with 10,000 locations, finding the shortest path by hand is humanly impossible.
Our technology
- The grid is represented as an implicit graph, where each cell is a node and adjacent cells are connected by edges with different weights for movements orthogonal and diagonal.
- Evaluation function f(n) = g(n) + h(n), where g(n) is the actual cost from the start node and h(n) the heuristic that estimates the remaining cost.
- The simulation is fully interactive: every change to obstacles or to the start/end points immediately restarts the search.
ROI and business impact
- Automated warehouses: shortest paths for picking and storage robots, reducing order fulfilment times by 20-30%.
- Robotics and drones: motion planning in environments with obstacles, guaranteeing safe and efficient paths.
- Logistics and transport: routes for delivery fleets optimising fuel and time in complex environments.
- Evacuation and safety systems: simulation of optimal escape routes in crowded environments with unexpected obstacles.
Do your robots or logistics systems follow inefficient paths or struggle to handle obstacles?
We calculate optimal paths in complex environments through pathfinding algorithms, adapting navigation to obstacles and operational constraints, reducing distances, travel times and waste.
Optimise your systems' pathsChoose an option: Process Analysis - Request an Audit - Talk to a System Architect

Click and drag to draw walls and obstacles on the grid.
The system automatically calculates paths from left to right and from top to bottom.
Use the "Random" button to generate random walls.
Use the "Restart" button to start over.
Adjust the "Speed" slider to change the simulation speed.
Value for your company
- The Dijkstra algorithm calculates the shortest path from a source to all reachable destinations in a network - essential for logistics, telecommunications, transport systems and handling.
- In this simulation, thousands of agents autonomously find the optimal path through a field of obstacles, demonstrating how vehicle fleets, data packets or operational staff can be routed efficiently.
What we solve
- Inefficient routing: without a shortest-path algorithm, every agent follows a suboptimal route, accumulating delays and consumption.
- Scalability: with thousands of agents moving simultaneously, you need an algorithm that calculates all paths in parallel in real time.
- Dynamic adaptation: do obstacles change? The system must recalculate all affected paths instantly.
Our technology
- The grid is represented as an implicit graph where each cell is a node connected to its neighbours.
- The Dijkstra algorithm is run in real time for each source, calculating the minimum distances to all reachable cells.
- The simulation is fully interactive: every change to obstacles triggers immediate recalculation of the paths.
ROI and business impact
- Logistics and transport: route planning for delivery fleets optimising fuel and travel times.
- Telecommunication networks: optimal routing of data packets in complex networks with dynamic constraints.
- Video games and simulations: pathfinding for characters and autonomous vehicles in environments with dynamic obstacles.
- Evacuation systems: optimal escape routes in crowded environments.
Do you need to optimise fleet routes, logistics flows or communication networks?
We calculate shortest paths on complex networks to route vehicles, data and operational resources, even in the presence of obstacles, reducing distances, delays and routing inefficiencies.
Optimise the routing of your flowsChoose an option: Process Analysis - Request an Audit - Talk to a System Architect
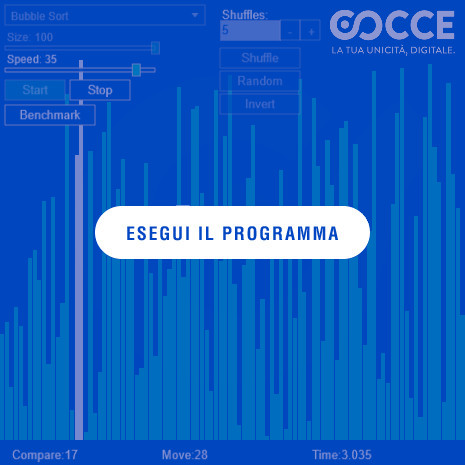
Select an algorithm to see how it works.
Use the controls to adjust speed and array size.
Value for your company
- The sorting algorithms underpin any information system: databases, search engines, data analytics, recommendation systems and much more.
- Choosing the right algorithm for the right context can make the difference between processing that takes seconds and one that takes hours. Quick Sort, Merge Sort, Heap Sort - each has its strength depending on the data and constraints.
What we solve
- Degraded performance: a database with millions of records sorted with the wrong algorithm takes orders of magnitude longer than necessary.
- Algorithm choice: without knowing computational complexities, developers use the simplest algorithm (Bubble Sort) even when it is not appropriate.
- Memory constraints: in embedded or IoT systems, the available memory dictates which sorting algorithm is feasible.
Our technology
- Implementation of all classic algorithms: Bubble Sort, Quick Sort, Merge Sort, Heap Sort, Insertion Sort, Selection Sort.
- Each algorithm runs asynchronously to ensure smooth visualisation without blocking the browser.
- Rendering optimised via Canvas to handle in real time the animation of thousands of elements.
ROI and business impact
- Databases and information systems: sorting records by primary keys, dates or priorities - faster responses to users.
- Data processing and analytics: preparing datasets for machine learning or statistical visualisation with optimal performance.
- Embedded and IoT systems: sorting sensor streams to detect patterns or anomalies in real time on resource-constrained devices.
- Binary search: sorted data enables O(log n) searches instead of O(n) - a factor of 1000x on datasets of one million elements.
Do your systems process large amounts of data with sorting times that are too long?
We analyse and optimise sorting strategies based on data volume, performance and memory constraints, improving processing efficiency and response speed.
Optimise your data processingChoose an option: Process Analysis - Request an Audit - Talk to a System Architect

Click on the background to add a new Bot.
Use the "Restart" button to restart the simulation.
Use the "Pause/Resume" button to interrupt progress.
Value for your company
- The Voronoi diagram divides space into regions based on the distance from generating points - a very powerful tool for territorial analysis, logistics, market segmentation and network planning.
- Each cell represents the area of responsibility closest to a reference point: useful for optimising coverage areas of branches, warehouses, logistics hubs, retail outlets or service stations.
What we solve
- Arbitrary territorial division: the boundaries of areas of responsibility are decided by hand, without an objective criterion of optimality.
- Uneven coverage: some service points are overloaded while others are underused - Voronoi helps to redesign the boundaries.
- Analysis difficulties: without a geometric partition of space, it is difficult to answer questions such as "which is the service point closest to this customer?".
Our technology
- Construction of the diagram with Fortune's Algorithm, complexity O(n log n).
- Calculation of cell edges and vertices with stable handling of edge cases and clipping.
- Real-time updating via Delaunay triangulations and spatial data structures for efficient distance calculation.
ROI and business impact
- Spatial and territorial analysis: dividing areas based on points of interest (hospitals, schools, sensors, branches) to visualise coverage areas.
- Logistics: defining catchment areas for warehouses and distribution hubs, minimising delivery distances.
- Territorial marketing: market segmentation by areas of influence of retail outlets or showrooms.
- Image processing and computer vision: segmentation based on proximity.
- Scientific simulations: modelling of crystallisation, cell growth or resource distribution.
Do you need to optimise coverage areas or define areas of responsibility for offices, warehouses and retail outlets?
We use Voronoi tessellation to divide the territory based on the proximity of service points and analyse areas of influence, improving resource distribution and territorial coverage.
Optimise your territorial coverageChoose an option: Process Analysis - Request an Audit - Talk to a System Architect

Value for your company
- The fuzzy logic controller intelligently and adaptively manages complex systems where variables are not perfectly known or linear - perfect for smart traffic lights, industrial flow regulation, control of non-linear processes and congestion management.
- Unlike traditional binary control (on/off), fuzzy logic reasons in terms of "low", "medium", "high" - as an experienced human operator would - producing smooth, natural transitions.
What we solve
- Rigid threshold control: traditional systems switch on/off abruptly, causing oscillations and instability.
- Non-linear processes: many industrial processes have behaviours that a linear PID cannot manage adequately.
- Uncodified expert knowledge: experienced operators know how to adjust the process "by feel", but that know-how is not transferred into automation.
Our technology
- The controller receives inputs from sensors and converts them into fuzzy values via membership functions.
- System rules defined in IF-THEN format that produce as output the optimal control value.
- The defuzzification process translates the fuzzy result into a concrete numeric value for the actuators.
ROI and business impact
- Smart City and mobility: adaptive traffic light management to reduce congestion, emissions and travel times by up to 30%.
- Industrial process control: furnaces, mixers and chemical plants where fuzzy logic provides a stable response even with non-linear parameters.
- Internal logistics flow management: coordination of traffic lights for industrial vehicles (forklifts, AGVs, pallet trucks) improving safety and productivity.
- Production cycle optimisation: automatic load balancing between stations on an assembly line.
Do your processes require adaptive control to handle complex variables and non-linear behaviours?
We apply fuzzy logic to regulate industrial flows, automation systems and variable processes through intelligent rules, improving stability, responsiveness and congestion management.
Explore intelligent process controlChoose an option: Process Analysis - Request an Audit - Talk to a System Architect

Value for your company
- The particle engine manages thousands of elements subject to gravity, collisions and dynamic interactions - used for data visualisation, real-time monitoring, scientific simulations and interactive interfaces.
- Each particle can represent a data point: a financial transaction, an IoT sensor, a fleet vehicle or a customer. Movement and interactions between particles make large volumes of data visually understandable.
What we solve
- Data that is hard to interpret: static tables and charts do not convey the dynamic evolution of phenomena in real time.
- Unintuitive monitoring: without immediate visualisation, anomalies go unnoticed until they cause damage.
- Low engagement: traditional corporate dashboards bore stakeholders - a dynamic interface captures attention.
Our technology
- Real-time update of position, velocity and acceleration for each of the thousands of particles.
- Collision detection with a spatial grid for smooth performance even at maximum load.
ROI and business impact
- Financial data visualisation: particles representing transactions, animated by volume or value, for a dynamic overview of the market.
- IoT network monitoring: particles indicating node status, changing colour based on temperature, signal or activity - anomalies visible immediately.
- Scientific simulations: visualisation of complex flows such as fluid movement or wave propagation.
- User interfaces and gamification: dynamic visual feedback for web applications, mobile, interactive kiosks and corporate training.
Do you have large volumes of data that are hard to interpret through dashboards and static charts?
We turn data and interactions into dynamic visualisations to monitor IoT systems, operational flows and complex phenomena, making anomalies and behaviours easier to spot immediately.
Give shape to your dataChoose an option: Process Analysis - Request an Audit - Talk to a System Architect

Use the "Recreate graph" button to start over.
Drag the points to change their layout
Use the "Stop auto-adjustment" button to interrupt the automatic layout functionality.
Value for your company
- ForceAtlas2 automatically transforms the structure of a network into a readable two-dimensional layout, highlighting communities, central nodes and key relationships.
- Every company has hidden networks: relationships between customers, suppliers, products, production flows, informal organisation charts. ForceAtlas2 makes them visible and interpretable.
What we solve
- Untapped relational data: you have data on connections but cannot visualise it in a way that tells a story.
- Hidden communities: without a force-directed layout, clusters and groups remain invisible within the connection matrix.
- Unidentified central nodes: which are the key elements of the network? ForceAtlas2 places them at the centre naturally.
Our technology
- Simulation of an iterative physical system: nodes and edges interact like electric charges and springs (Hooke's law).
- For large graphs, Barnes-Hut optimisation reduces computation times.
- Parallelised algorithm also available in JavaScript/WebAssembly for interactive web uses.
ROI and business impact
- Marketing and business: visualisation of links between customers, products and suppliers to identify cross-selling and up-selling opportunities.
- Investigations and compliance: mapping relationships between people, groups and events for audits and due diligence.
- Semantic graphs and knowledge graphs: representation of concepts and entities for recommendation systems and semantic search.
- Manufacturing and Industry 4.0: tracking of production flows and interconnected machinery.
Do you want to identify hidden relationships, groups and strategic nodes in your company's data?
We visualise complex networks of customers, suppliers, processes and interconnected systems to reveal communities, dependencies and key relationships, turning relational data into information useful for decisions.
Map the relationships in your ecosystemChoose an option: Process Analysis - Request an Audit - Talk to a System Architect
Select a type of algorithm to use
Use the "Cycle tests" button to cycle through the various algorithms available
Use the "Reset" button to start again.
Value for your business
- Bin Packing solves the problem of allocating objects of different sizes within the minimum number of containers - from logistics to shipping, from packaging to production planning.
- Every centimetre of space not used in a container, a lorry or a packaging is wasted money. Our heuristic algorithms find the optimal arrangement in times compatible with production requirements.
What we solve
- Inefficient manual loading: operators load containers "by eye", leaving gaps that could have been filled.
- Avoidable multiple shipments: a poorly optimised load requires one extra container, doubling transport costs.
- Waste of packaging material: without optimisation, boxes that are too large or too much secondary packaging are used.
Our technology
- 6 heuristic algorithms implemented to obtain near-optimal solutions in acceptable times. The "RMax" algorithm proves the most efficient.
- Support for 90° rotation of items and fixed-size containers.
ROI and business impact
- Transport cost reduction: 15-25% - fewer containers and lorries needed for the same volume of goods.
- Logistics and transport: load optimisation for lorries, containers or other means of transport.
- Production processes: organisation of production stages to maximise efficiency and reduce material waste.
- Packaging and shipping: optimal arrangement of items inside boxes or parcels, reducing volume and shipping costs.
Do you want to reduce transport costs and make the most of the available space?
We optimise the arrangement of products, parcels and materials inside containers, lorries and packaging, reducing wasted space and the number of shipments required.
Optimise loading and reduce wasteChoose an option: Process Analysis - Request an Audit - Talk to a System Architect

Use the knob to change the number of neurons in the hidden layer.
Use the "Next turn" button to play a single game.
Value for your business
- This demo shows a feedforward neural network that learns autonomously to make decisions - the same architecture used for demand forecasting, classification, inventory optimisation and recommendation systems.
- The neural network learns from its own experience, improving performance over time exactly as a demand forecasting system would refine its estimates with every sales cycle.
What we solve
- Inaccurate forecasts: without machine learning, forecasts rely on historical averages or intuition, with errors that lead to overproduction or stock-outs.
- Manual classification: sorting, categorising or prioritising items by hand is slow, costly and subjective.
- Systems that do not learn: a deterministic system repeats the same errors. A neural network adapts and improves.
Our technology
- Implementation of a Feedforward Neural Network with 38 input neurons, a configurable hidden layer and a binary decision output.
- The architecture is the same one used for classification, regression and forecasting problems in the real world.
ROI and business impact
- Demand forecasting: anticipate sales to optimise production and inventory, reducing stock-outs and overproduction.
- Intelligent procurement: identifying and forecasting the items that most easily run out of stock.
- Classification and pattern recognition: automation of categorisation activities that today require human resources.
Do you want to improve demand forecasts and optimise inventory?
We apply neural networks and machine learning to analyse data, recognise patterns and support business decisions, anticipating demand and reducing forecast errors, overproduction and stock-outs.
Optimise forecasts and inventoryChoose an option: Process Analysis - Request an Audit - Talk to a System Architect
Use the text edit field to replace the target string.
Use the "Epidemic" button to limit the number of minions.
Value for your business
- Genetic algorithms are inspired by Darwinian evolution: a population of solutions evolves over time through selection, crossover and mutation, converging towards the optimal result.
- They are particularly effective when the solution space is too vast for exhaustive search - scheduling, routing, parameter optimisation, network design and combinatorial problems.
What we solve
- Problems with too many variables: when the possible combinations run into billions, no brute force can find the optimal solution.
- Multi-objective optimisation: genetic algorithms naturally handle trade-offs between conflicting objectives (cost vs quality, time vs resources).
- Solutions that improve over time: unlike static heuristics, the genetic algorithm keeps evolving and finding better solutions.
Our technology
- Implementation of a genetic algorithm with selection, crossover and random mutation to guarantee the evolution of the population.
- Limited primary resource ("food") that models realistic constraints of budget, time or materials.
ROI and business impact
- Spatial route optimisation: fleet and delivery routing with multiple constraints.
- Production scheduling: optimal sequencing of orders on parallel machines with setup times.
- Network design: configuration of distribution, telecommunications or sensor networks with optimal coverage.
- Any quantifiable problem: a genetic algorithm can search for the best solution in any solution space where a fitness function exists.
Do you have a complex problem with too many variables to optimise?
We use genetic algorithms to explore combinations, evaluate alternatives and progressively improve solutions, optimising scheduling, routes, resources and configurations according to your objectives.
Optimise your processes with genetic algorithmsChoose an option: Process Analysis - Request an Audit - Talk to a System Architect

Value for your business
- The 2D Car Steering System combines neural networks and genetic algorithms to create an autonomous driving system that learns on its own to navigate a route - the same technology behind self-driving vehicles, industrial AGVs, lawnmower robots, drones and automated handling systems.
- The virtual car has five front sensors that measure the distance from obstacles: an architecture identical to that of real mobile robots that use infrared, ultrasonic or LiDAR sensors.
What we solve
- Manual trajectory programming: writing movement instructions by hand for every scenario is complex and not scalable.
- Adaptation to variable routes: a production environment changes continuously - the system must adapt without being reprogrammed.
- Neurorobotics: the evolutionary approach makes it possible to train the system in simulation and transfer the experience to the real robot (sim-to-real).
Our technology
- The cars are driven by a Feedforward Neural Network with 5 inputs (distance sensors) and 2 outputs (motor and steering).
- The network weights are trained with a genetic algorithm, simulating natural evolution to select the best drivers.
ROI and business impact
- AGVs and mobile robots: autonomous navigation systems for warehouses and factories that learn to move in complex environments.
- Lawnmower and cleaning robots: autonomous mapping and navigation without the need for perimeter wires or floor markings.
- Automatic sensor calibration: the system learns to interpret the sensors and to compensate for drift and inaccuracies.
- Rapid prototyping: training in simulation before deploying on real hardware, reducing development time and costs.
Do you want to make your handling systems more autonomous and intelligent?
We combine neural networks and genetic algorithms to develop navigation systems capable of learning and adapting to obstacles, optimising the movement of AGVs, mobile robots and automated systems.
Explore the potential of autonomous drivingChoose an option: Process Analysis - Request an Audit - Talk to a System Architect